 PiCUS : TreeTronic® Electrical Impedance Tomograph
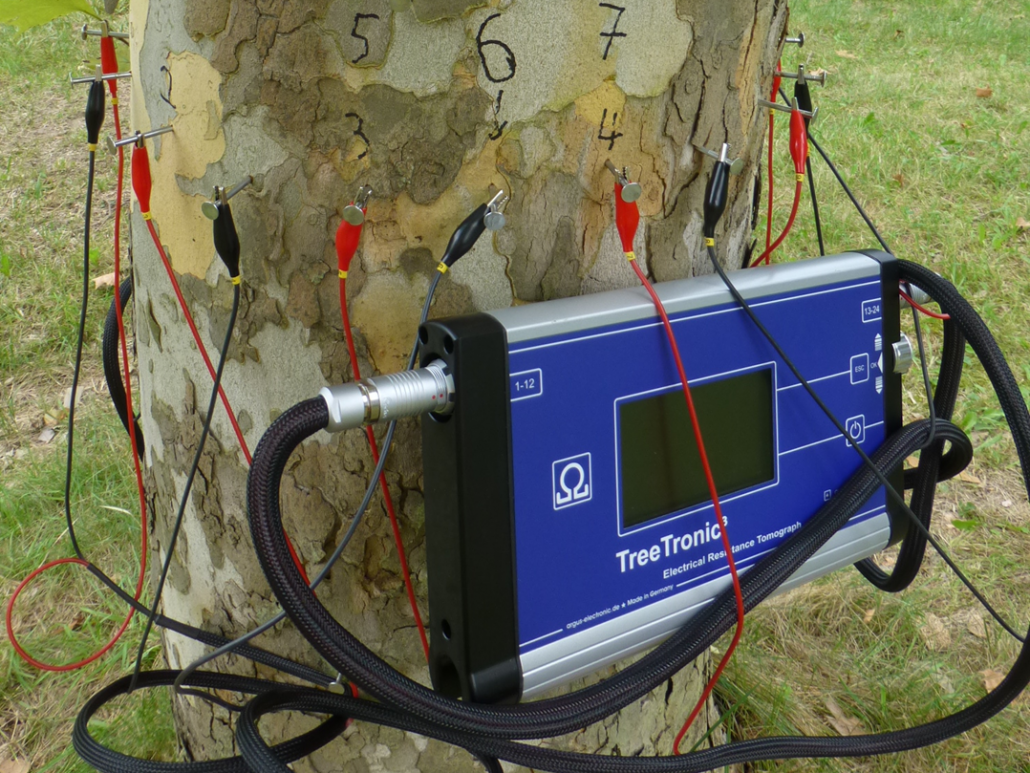
The TreeTronic® system uses electric current/voltage to investigate the internal properties of the tree. The result of the measurement is a 2 dimensional map of the electrical impedance (EI) of the tree. The TreeTronic tomograms show in particular the early stages of decay and support in analyzing sonic tomograms. The combined application of the PiCUS Sonic Tomograph and the Treetronic is the most advanced imaging technology for tree inspections.
Treetronic Theory
The PiCUS Treetronic measures the chemical properties of wood such as water content, cell structure etc. Since these properties are changed if there is decay in a tree, the Treetronic tomograph can detect and measure how the non-uniform wood is “bending” the electrical field.

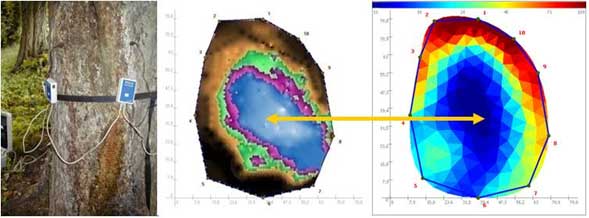
The sketch on the right shows the electrical field in a uniform material. The field is distorted if the material is not uniform as in the centre and right sketch.
When combined with the sonic tomograph, the EI tomographs offer advanced information about the tree. In many cases the result can be used to analyse the type of decay or help to distinguish between cavities and ‘wet’ diseased wood. Water transportation in the trunk can be analysed by scanning a tree at several levels.
The tests are easy to perform: the wires of the TreeTronic are connected to the nails used for the sonic investigation and the measurement runs automatically.

Combined Analysis of Sonic Tomographs and Electrical Impedance Tomographs
The combined evaluation of PiCUS sonic tomographs and electrical impedance tomographs offers additional information about both the type and location of defects in trees. In particular, it is possible to:
- Distinguish between different types of damage (e.g. crack/cavity vs. decay)
- Detect early stages of decay
- Obtain information about areas above or below the measuring level. This can assist with analysing root decay problems.
 The EI Tomographs use colour coding:
Blue colours indicate areas of low impedance (high water content etc)
Increasing impedance
Red colours indicate areas of high impedance (lower water contents etc)
Examples
Chestnut Tree 1
The sonic tomograph (centre) shows a damaged area, but the nature of the damage can be difficult to determine.
Analysing the EI tomograph (right), we see the blue colours that indicate areas of low impedance. These areas are likely to have high water contents. This information indicates that the blue area in the sonic tomograph image (centre image) is likely to be wetwood rather than a cavity.

Chestnut Tree 2
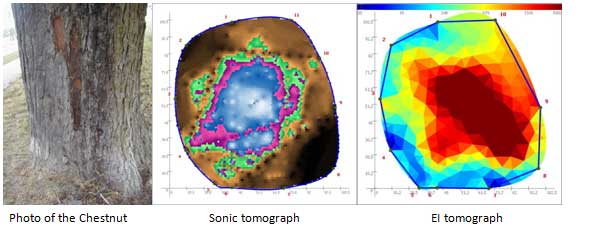
In contrast to Tree 1, Tree 2 is very dry inside, as the red colours of the EI tomograph (right) show. This clearly indicates that the tree is not infected by wet wood and therefore the blue area in the centre of the sonic tomograph is most likely a dry cavity. In this case, the EI Tomograph indicates an area of very high impedance and the sonic tomograph indicates low density.

Beech with 3 Trunks, Decay and Bark Inclusion
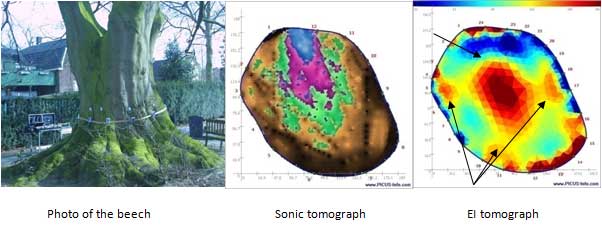
The size or extent of the damage shown in the sonic tomograph is difficult to evaluate because the bark inclusions between the three stems disrupt the sonic signals and may make the tomograph appear worse than the true internal situation. The EI tomograph shows the probable locations of the bark inclusions (red area in EI tomograph). The size of the fungal infection (blue area in EI tomograph) is obviously very small and corresponds more closely with the blue area in the sonic tomograph.

