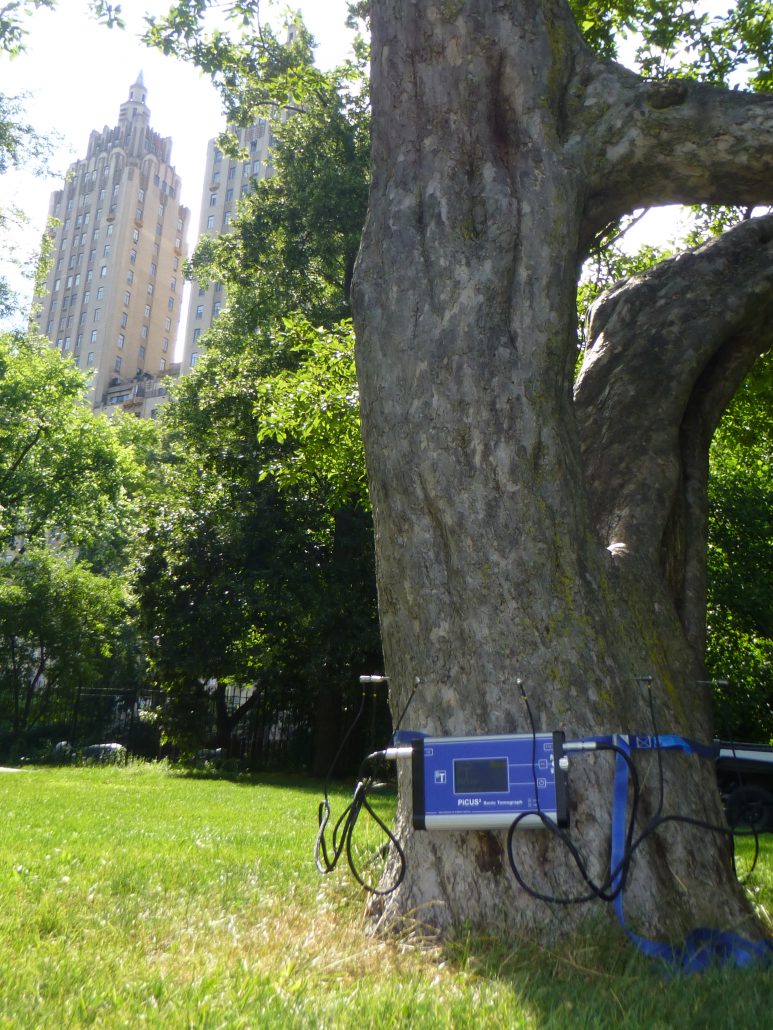
 The PiCUS Sonic Tomograph is used to investigate the internal condition of a tree using sound waves. A series of nails are installed around the tree at the measuring plane where visual inspections have identified weaknesses requiring further investigation. These nails become the measuring points and are used to send or receive sound waves. The distances between the measuring points are carefully measured and recorded by the field technician. The sound waves are generated by a hammer tapping on one of the nails. The PiCUS instrument measures the time of flight of sound waves between the sending point and the other receivers. The software calculates the apparent sonic velocities (distance/time) and draws a “velocity” or “density” map of the tree by combining the measured tree geometry with sonic data recorded during the assessment. The sonic velocity can be correlated with wood densities and therefore with the soundness of the wood. The introduction of the electronic hammer allows for full resolution tomography images to be recorded with as few as 6 to 8 sonic sensors.
The PiCUS Sonic Tomograph won the Technology Award 2000 from the German Federal State of Mecklenburg-Vorpommern.


Advantages of using the PiCUS
- New compact system design: one main control unit and only two cables.
- Rapid data collection with 6 to 12 sensors operating on up to a 100 measuring points.
- No field computer is required. The PiCUS works independently simplifying logistics.
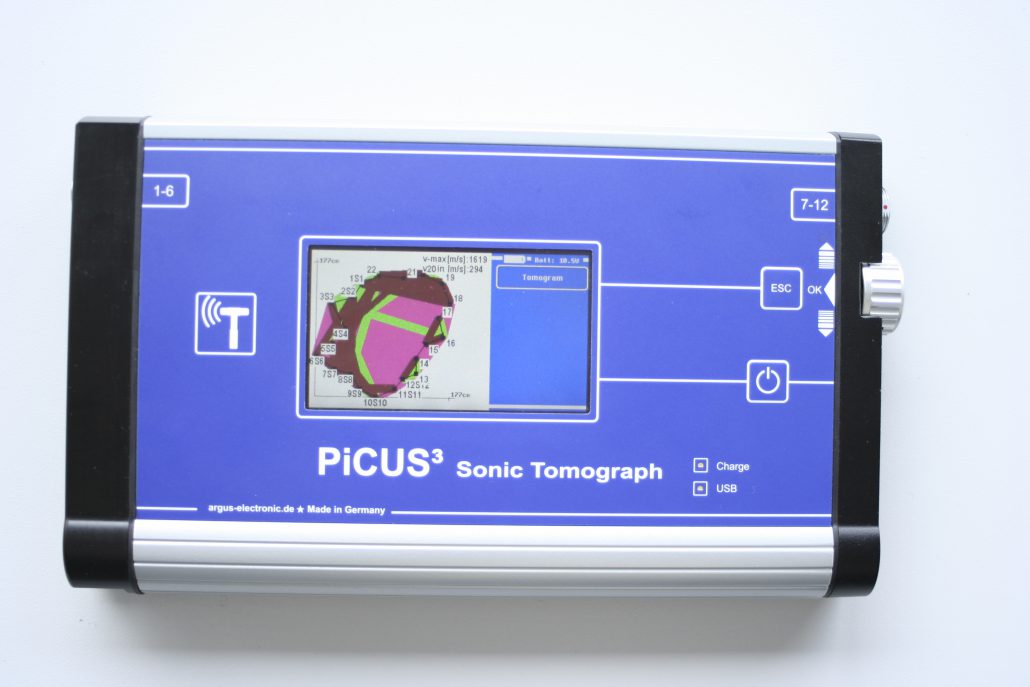
- Preview the sonic tomogram in the field on the main control unit.
- Tomograms are easy to understand and to explain to clients.
- Easy to use – From complex buttress roots to aerial assessments.
- Provides high resolution with few sonic sensors and can be used on any mature tree.
- PiCUS Q74 software includes 3D image overlay and crack detection.
- Sensors are easy to mount and can be placed in tight inclusions.
- Works independently of ambient conditions (noise of cars, wind etc.).
- Collect accurate and fast geometry with PiCUS 3 electronic calliper.
- Field tested, high quality hardware water resistant and durable.
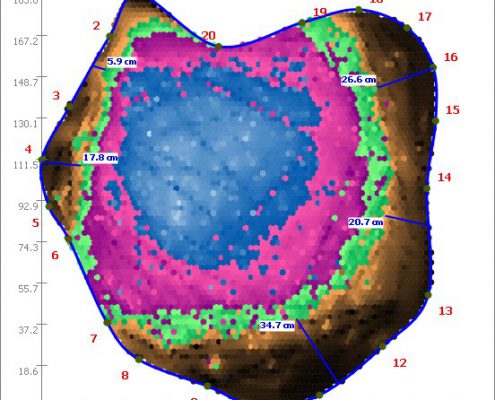
2D View of a Tree
Tomograph images are generated at the site as soon as the measurements are completed. A number of functions are available for data analysis and presentation. Measurements of residual walls and the extent of decayed areas can be taken directly from the tomograph image. The images can also be saved as digital files that can be exported into other software and used for presentations and reports.
3D View of a Tree
The 3D function can be used to combine multiple tomographs from the same tree. If the technician records the tomograph images with a similar compass orientation and aligns the measuring points, the software will combine them into a three-dimensional image. The image can then be turned and manipulated to provide unique views of the internal columns of decay. These views can help to provide further information from which risk assessment decisions can be made.
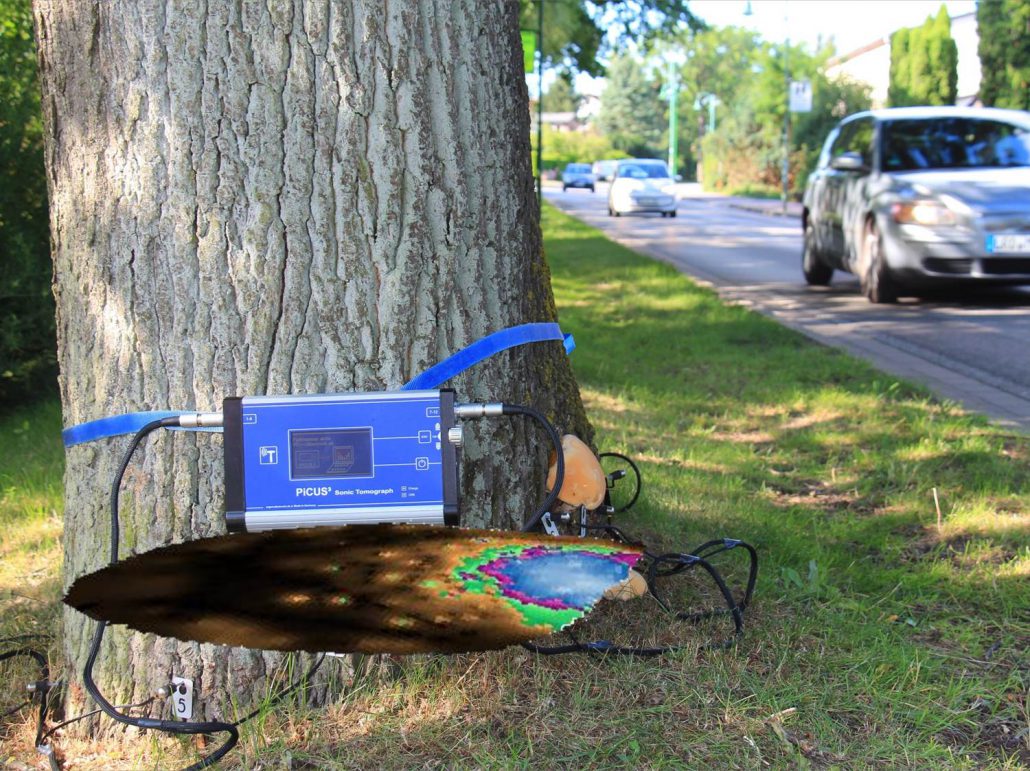
2D Perspective Overlay
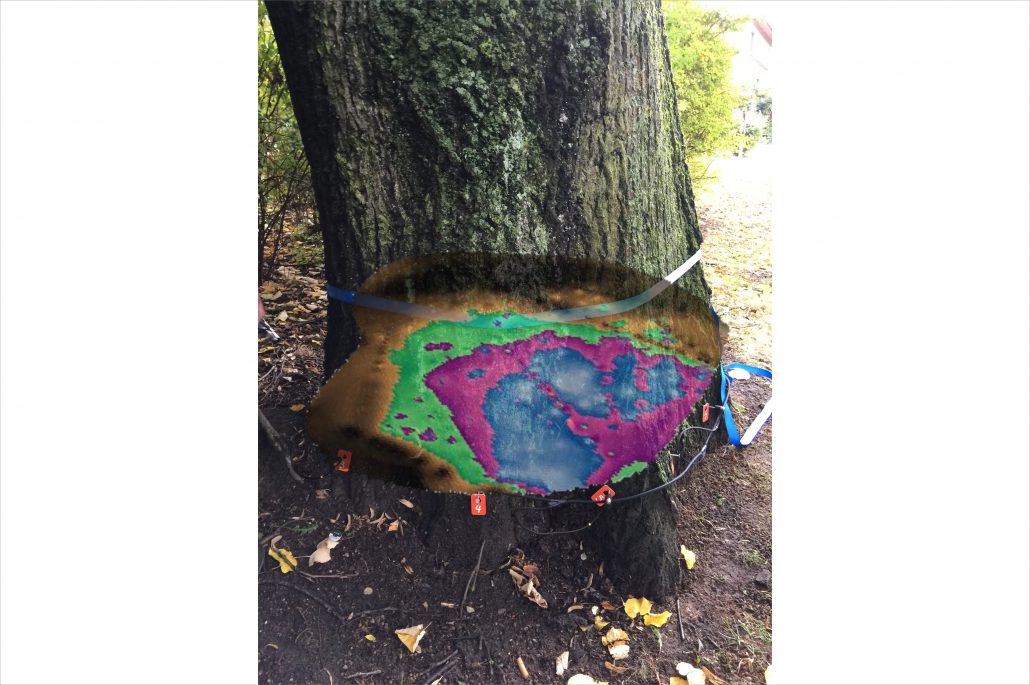
Using the Q-74 expert Software, practitioners can easily load perspective tomograms onto photos of the tree in order to present a unique view of the external an internal details.


Geometry is Important – There is no Circular Tree
To generate the best tomograph images, the geometry must be measured as accurately as possible.
There are several different options in the software that allow the technician to choose the most appropriate method to accurately measure the geometry of the cross-section. The “free shapes” method is the most accurate way to measure tree geometry. The PiCUS software utilizes triangulation theory to calculate the correct shape of the tree. The sketch at right illustrates the measurements required to reconstruct the cross-section of a tree. While the distances can be measured with any standard calliper and entered into the PiCUS software, the PiCUS Calliper 3 has been specifically designed to streamline and improve the efficiency and accuracy of calculating tree geometry.
![]()
PiCUS Calliper
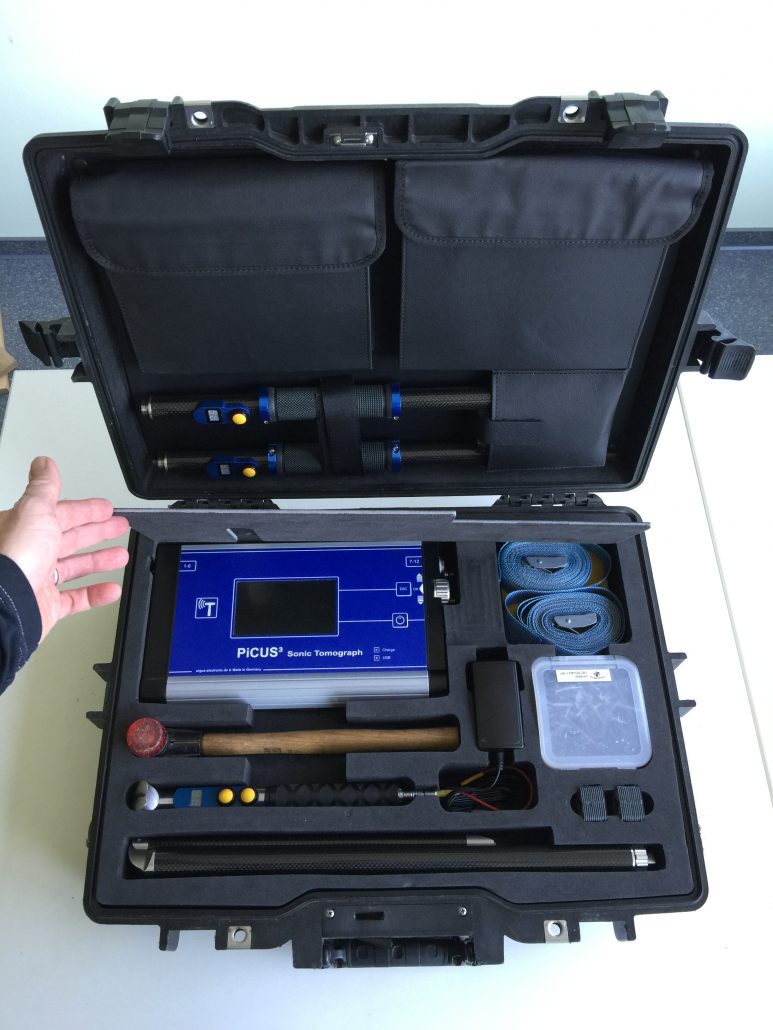
The PiCUS Calliper allows for quick and precise measurements of even the most complex trees and root flares. With Bluetooth connectivity and automatic integration with the expert software, the PiCUS Calliper is the fastest and most reliable tool to record tree geometry.
The PiCUS Calliper 3 was integrated into the carrying cases of both PiCUS 3 and Treetronic 3. The modular design of the callipers allows the storage of all parts in the robust carrying case. The PiCUS Calliper 3 can be assembled easily on site in two different working-sizes: 1630 or 2150 mm.
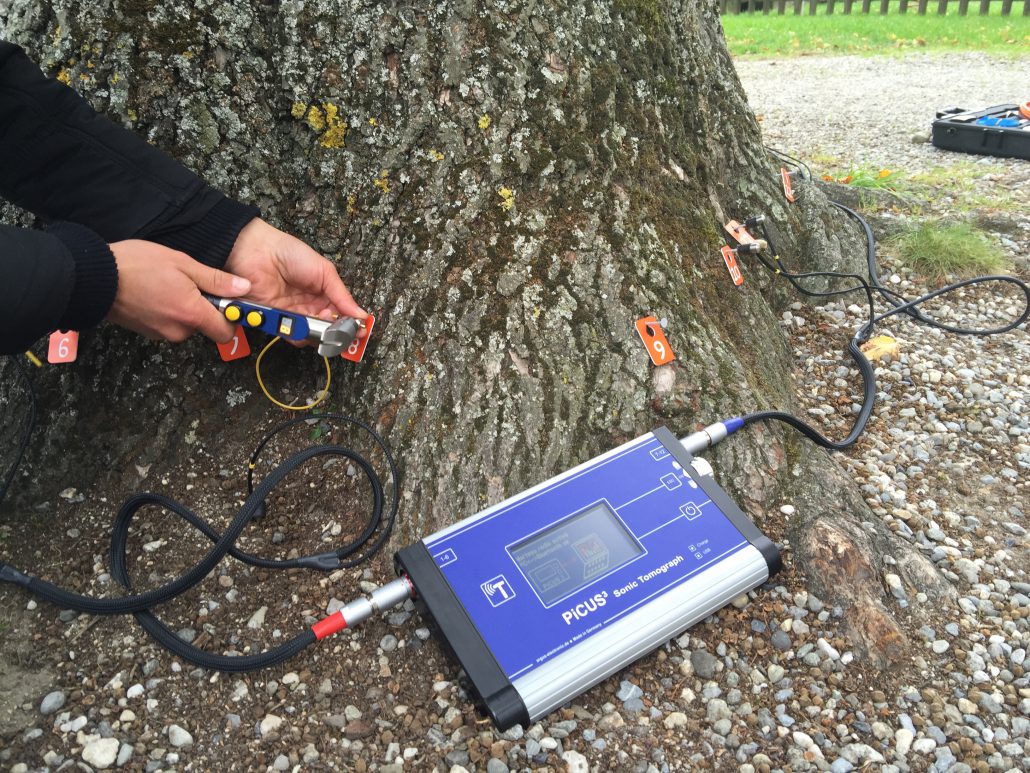
Recording Sonic Data
The standard method of measuring the sonic data is to attach one sensor to each measuring point (nail). The time of flight of sound waves generated by tapping each nail is recorded at each of the other sensors and used to calculate the tomoraph. The sketch illustrates this method.

Using more measuring points than sensors
The circumference and outline (shape) of the tree determine the number of measuring points (test points) for a PiCUS sonic scan. The PiCUS software differentiates between sensors and measuring points (MP). Since a MP is a simple nail, a PiCUS scan can include as many measuring points (nails) as needed regardless of the number of actual sensors available. The photo below shows a setup of 12 sensors on 24 MP. The electronic hammer can create sonic signals on all 24 MP, regardless of whether a sensor is currently attached to the nail or not.

Colours of the Tomograph Image
The powerful software compares all velocities recorded at one measuring level to show where the sonic waves travel slower as compared to the “fastest” areas.
There are three main colour groups to note when analysing tomograph images:
- Brown colours (light brown to dark brown)
- Green colours
- Violet-Blue-White colours
Shades of brown indicate sound wood, green areas indicate early decay; violet is decayed wood and blue indicates a cavity, a crack or wood so decayed that it will hardly transmit any sound waves. Using the images gathered with a tomograph, the critical areas for further testing can be identified.
The violet-blue-while colour area can be shown in violet colours only. The examples below show a tomograph image in standard, violet only (no blue) and grey colours. These colour definitions are part of the PiCUS Expert Software.
